
Below is a diagram of Virtual Servers hosted on a single physical server running VMware ESX for hosting Pentaho business intelligence, Confluence collaboration and JIRA issue tracking. Database access is isolated from the application layer via VLANS routed by an upstream router. All on one physical server. Isn’t virtualization great?!

If the adage “you can’t manage it if you can’t measure it” is true, the proliferation of systems necessitates better measurement and monitoring capabilities. Standard graphics like the ones below are used in many system and network management products to help better manage systems businesses rely on.
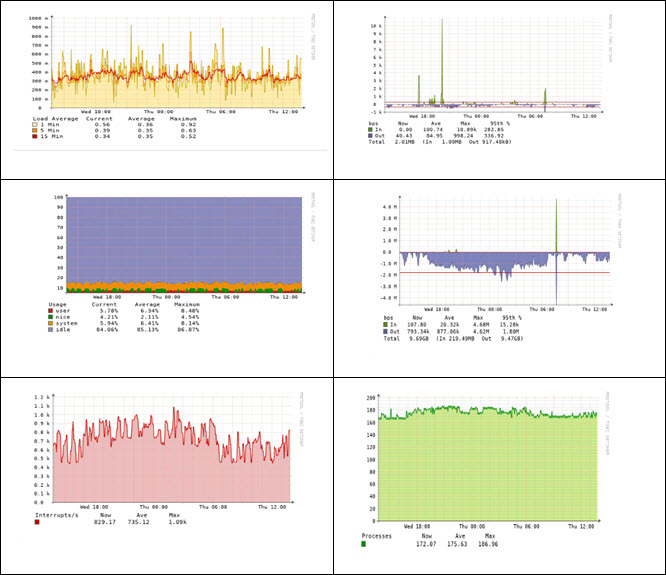
I have built many custom RRD graphs similar to the ones above based on metrics that are relevant to its audience. Not as graphically rich, but just as relevant were custom agents built to monitor system aspects relevant to the customer. Examples are, a set number of instances of a specific process, the existence of a particular process in memory or port activation on a network switch.